This autumn I paid for four AI plans: a $500 OpenAI plan, a corporate Claude seat, a $20 personal Claude plan, and Grok. My gut said the Claude seat gave me the most for the money, and I expected a week of usage logs to confirm it before I cut anything.
The logs confirmed it, but only in some units. Priced at API rates, the Claude seat came out ahead, at about $32 per dollar against $14.2 for one OpenAI allowance. Counted in total tokens or benchmark tasks, OpenAI came out ahead, by margins that ranged from small to wide. Counted in output tokens on one allowance, the seat led again. The plans did not change between those answers. Only the unit did. That is the main thing I learned: before asking which subscription is worth more, decide what you are counting, because that choice picks the winner.
The setup
I measured October 29 through November 4, the latest complete week all four plans shared. For each plan, I set the week’s share of its monthly fee against the same usage priced at published API rates. That API figure is a hypothetical bill, not money I saved.
One caveat shapes everything below: the two main plans did different work. I used OpenAI, through Codex, for my own projects: mostly Rust, plus TypeScript with Effect and some Python. The Claude seat covered corporate work. So this compares two kinds of work as much as two plans.
Count API dollars, and the seat wins
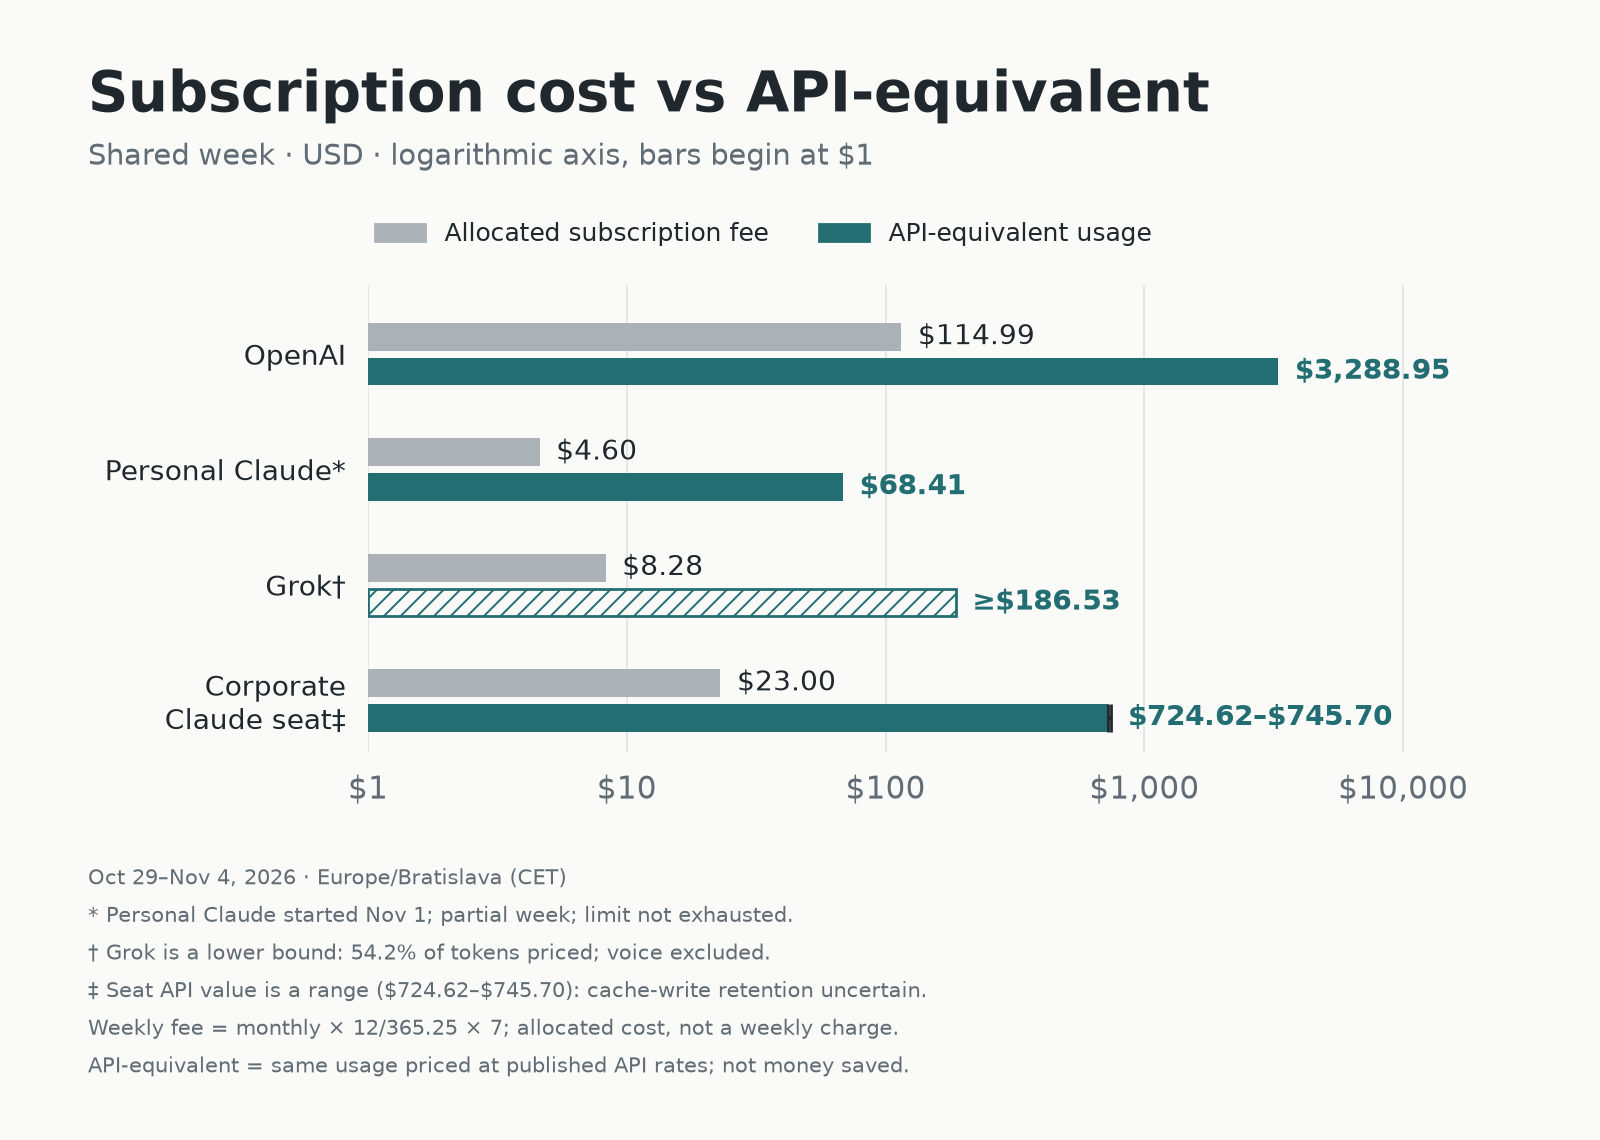
Figure 1. OpenAI’s bar includes early quota refreshes. Personal Claude started on November 1. Grok’s bar is a lower bound. The seat’s API value is a range because cache-write retention is uncertain.
The seat costs $100 a month on annual billing, or $23.00 a week. Its usage at API prices came to $724.62 to $745.70, about $32 per subscription dollar.
OpenAI’s weekly share of $500 was $114.99, against $3,288.95 at API prices: $28.6 per dollar. That figure is inflated. My weekly allowance often came back before the week ended: I counted 14 early refreshes over the period, and only one is a confirmed manual reset. A single allowance used to the end, from November 1 at 16:12 CET until it ran out on November 4 at 14:13 CET, held $1,635.36 of API-priced usage, about 90% of it from Sol 6.1 at low reasoning effort. That is $14.2 per dollar. Refreshes doubled the number, so from here on the fair OpenAI figure is the single allowance.
The seat wins this round for a simple reason: a Claude token costs more than a Sol 6.1 token. The same amount of work produces a bigger Claude bill, so pricing usage in API dollars rewards the more expensive model, not the more useful plan.
The two smaller plans cannot join the ranking. Personal Claude came to $14.9 per dollar, but it started on November 1 and did not hit its limit. Grok came to at least $22.5 per dollar, but I could price only 54.2% of its text tokens, and voice is excluded.
Count tokens and tasks, and the answer splits
OpenAI gave 131.3 million tokens per dollar over the week with refreshes and 66.1 million on the single allowance, against 59.2 million for the seat. That is between 1.1 and 2.2 times as many. Output tokens tell a different story. The single allowance gave 155.3 thousand output tokens per dollar, against 213.8 thousand for the seat, and the week with refreshes gave 349.5 thousand. So by output tokens on one allowance, the seat leads.
To get closer to actual work, I converted the usage into benchmark tasks. Artificial Analysis publishes what one Terminal-Bench 4.0 task costs at list prices for each model and reasoning effort. Dividing each model’s API-priced usage by that cost shows how many benchmark tasks the same spend would buy. These are not tasks I finished.
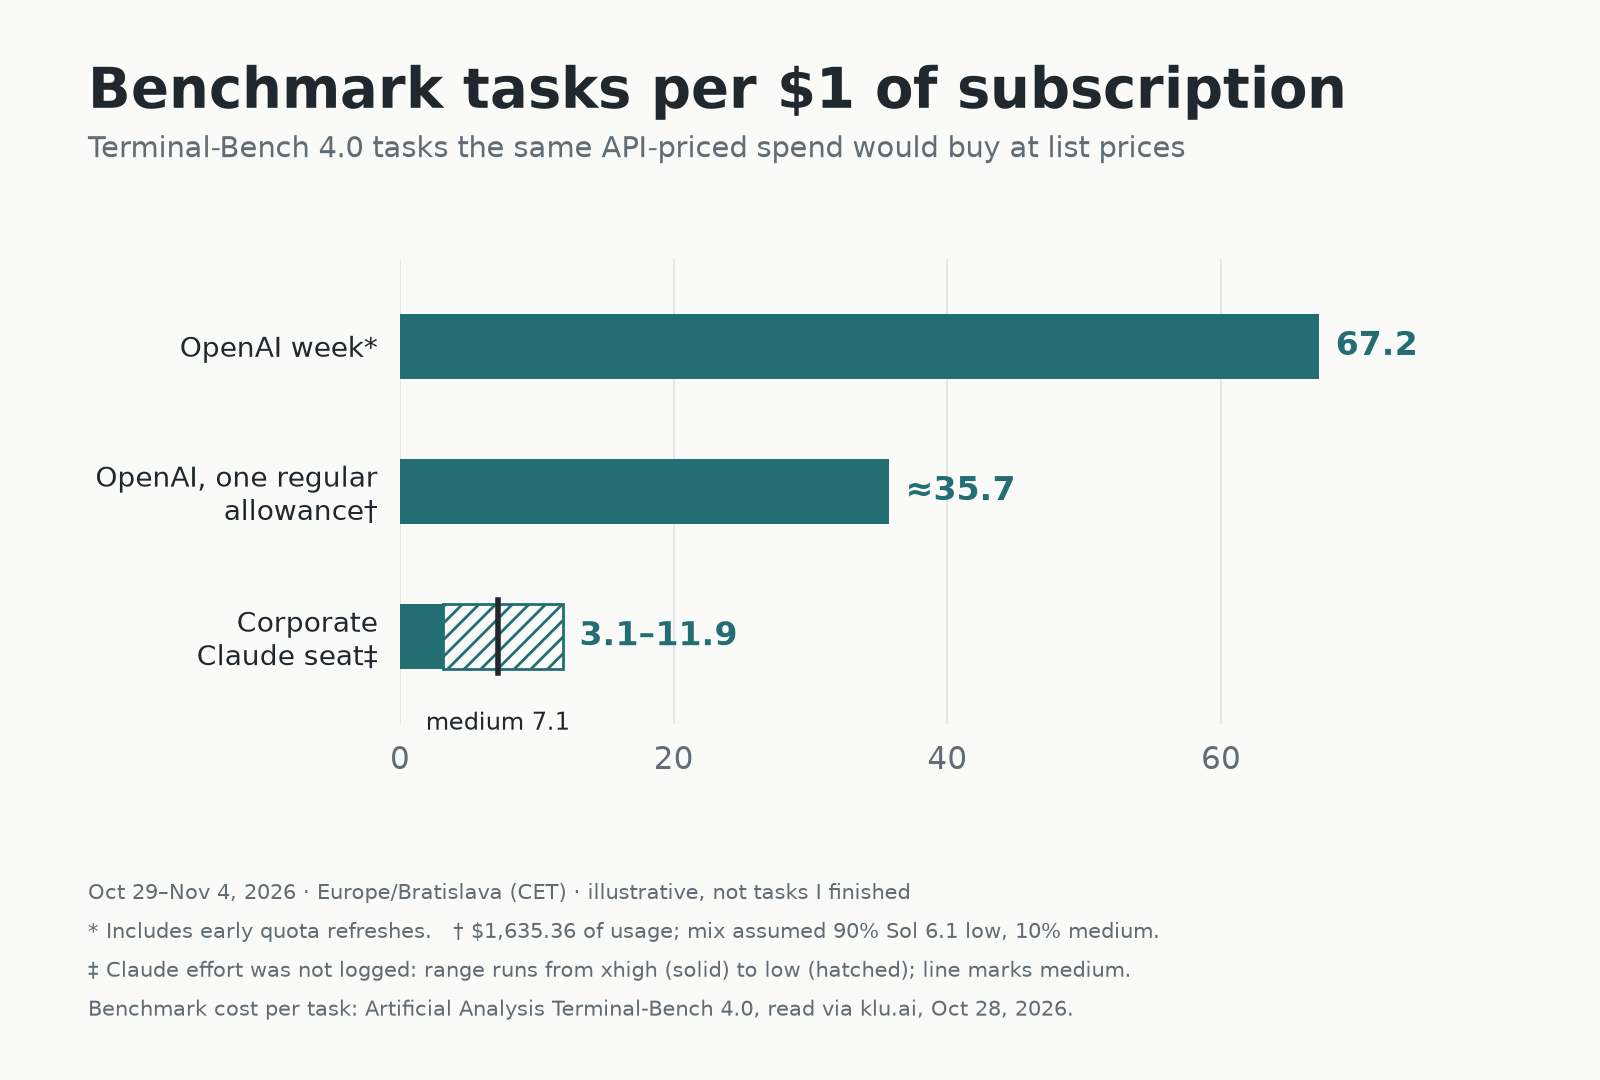
Figure 2. Illustrative. OpenAI’s week includes early quota refreshes. The single allowance assumes 90% Sol 6.1 at low effort and 10% at medium. I did not log Claude’s effort, so the seat is a range from xhigh to low effort.
The single OpenAI allowance comes to about 36 benchmark tasks per subscription dollar. With refreshes, the week reaches 67. The seat comes to 3 to 12, depending on effort: 3.1 at xhigh, 7.1 at medium, and 11.9 at low. The seat’s figure is below what Opus alone would give. About a third of its API dollars went to Fable 5.1, which costs more than twice as much per benchmark task, and a cheaper Sonnet share only partly offsets it. Counting only solved tasks keeps the order: about 11.4 per dollar for the single allowance, against 1.8 to 3.7 for the seat. Vals AI’s own Terminal-Bench 4.0 run agrees, with 16.6 tasks and 9.2 solved per dollar for OpenAI’s week against 2.3 and 1.5 for the seat.
This is not an independent check of the token count. At low effort, Sol 6.1 costs about $0.38 per benchmark task, and Opus at medium effort costs about $4.04. So the conversion mostly reflects price per task and tokens per task, not my productivity.
Why I hold every answer loosely
Every measure here has a soft spot.
Caching. Cached input was 98.7% of OpenAI’s tokens and 95.4% of the seat’s. Total token counts mostly measure context being re-read, not work being done. Output tokens avoid that, and on one allowance they favor the seat. But they depend on model, tokenizer, and reasoning effort, so they are not a clean unit of work either.
Unlogged effort. I did not log Claude’s reasoning effort, so the seat’s benchmark figure spans about four times, from 3.1 to 11.9.
A plan not pushed to its limit. I hit the seat’s limit earlier in the month, but not in the measured week. Its numbers show what I used, not what it could give.
Different work. This is also why my gut disagreed with the total-token and benchmark measures. Corporate work on the seat needs careful review: I check every change closely, so most of the time goes into my own verification, not into tokens. On my own projects, much of the work runs in an autonomous agent mode, which burns far more tokens for the same amount of my time. Any total-token measure will favor the plan that runs the agents.
If forced to pick, OpenAI looks better for my use, mostly on benchmark tasks. But the token and task measures do not agree with each other, and none of them counts finished work. I can’t call a winner from this week.
What I picked
The measurement did not make these decisions. They are judgment calls. I kept the corporate Claude seat. I moved OpenAI from the $500 plan down to the $100 plan to fit my budget, and kept it for Codex: its pull request reviews are good, the mobile app is convenient, and Sol 6.1 works well for me. I kept the $20 personal Claude plan and added Mistral for $15 a month, where I use Mistral Large 4. It looks cost-efficient so far, but I have not measured it. I plan to move Grok to the $30 plan. I keep it for Grok Bots, and its model is not the strongest one I use.
The experiment that would settle it
A week of logs gave me a hint, not an answer. The next attempt is designed around each caveat above:
- Run the same set of tasks on both tools, so the workloads match.
- Log reasoning effort for every run.
- Use one allowance on each tool to the end, so refreshes and unused headroom drop out.
- Count merged pull requests over four weeks, not tokens or API dollars.
The decision rule is simple: I keep the plan with more merged pull requests per subscription dollar.
How I counted
- I reconciled individual usage records from four computers and server environments, plus the Grok account dashboard.
- Weekly fee = monthly price × 12 / 365.25 × 7. For OpenAI at $500, the Claude seat at $100, personal Claude at $20, and Grok at $36, that gives $114.99, $23.00, $4.60, and $8.28.
- I priced each response at its model’s standard API rates, checked against the OpenAI, Anthropic, and Grok pricing pages on November 5. The Claude range comes from uncertain cache-write retention periods.
- Benchmark tasks per dollar = the sum, over models, of API-priced usage divided by that model’s Terminal-Bench 4.0 cost per task, then divided by the weekly fee. OpenAI’s effort comes from its logs. A small Claude model share with no benchmark row, 1.7% of the seat’s API-priced usage, is left out. Grok is left out of Figure 2 because its benchmark match is weak.
- I used paid extra usage on the Claude seat in early October, but none from October 29 to November 4.
- The shared week is frozen at November 5, 17:18 CET.
- Raw conversations, account identifiers, machine paths, and receipts are not published.
For professional contact, see the About page.